The Dutch Nature Suite
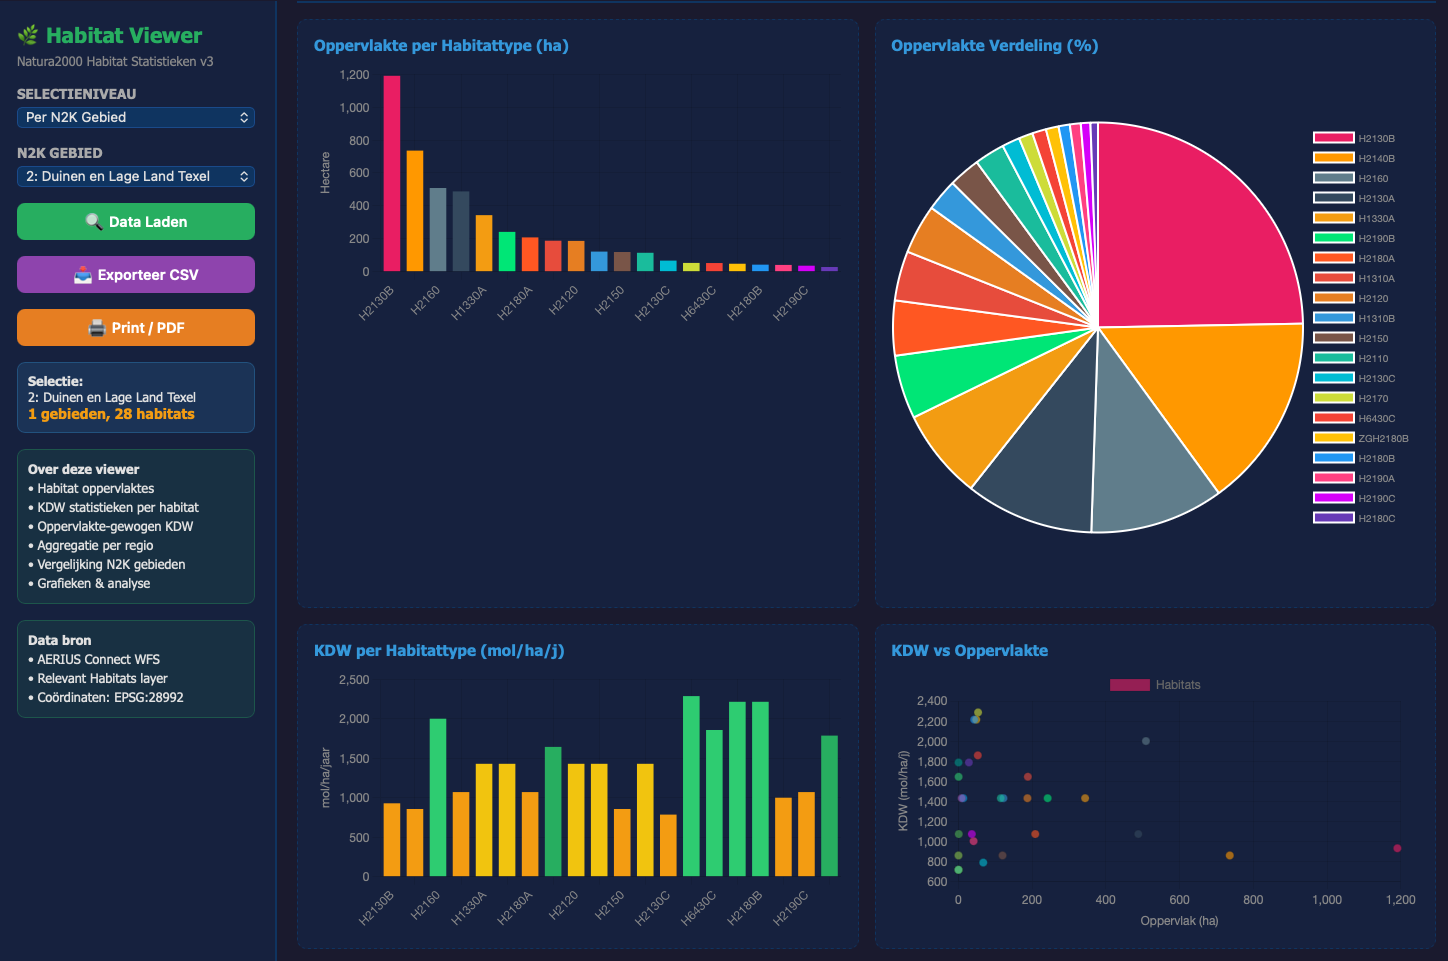
Habitat Statistics — N2k Regional Analysis
This interactive web application provides detailed habitat statistics for all 130 Natura2000 areas in the Netherlands. Users can analyze data at three levels: individual N2K area, province, or nationwide.
For each selection, the tool calculates habitat surface areas (hectares), critical deposition values (KDW), and area-weighted average KDW using live data from the AERIUS Connect WFS API.
It features an interactive map with color-coded habitat polygons, sortable statistics tables, six analytical charts, a sensitivity analysis by KDW class, and a side-by-side comparison of multiple N2K areas.
Results can be exported to CSV or printed to PDF. The tool helps ecologists and policymakers assess nitrogen-sensitive habitats across different administrative regions.
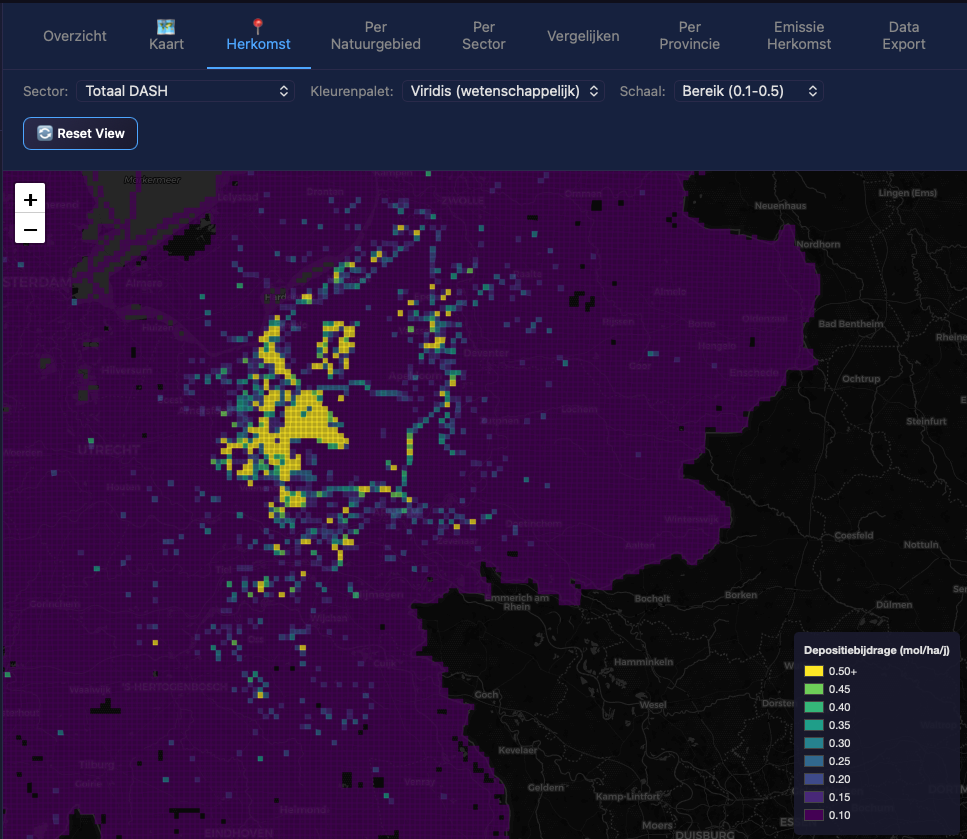
DASH Viewer - Insights in deposition origin
The DASH Viewer is a powerful, standalone HTML application that transforms raw RIVM DASH nitrogen deposition data into actionable insights. Simply point it to your DASH_RAW folder and instantly explore deposition patterns across all 131 Dutch Natura 2000 areas.
Features include interactive choropleth maps, province-level aggregation, sector breakdowns, area comparisons, and a new Emission Origin tab that traces deposition back to its provincial sources.
Switch seamlessly between deposition intensity and total load views, export data to CSV or Excel, and share findings without any server or installation required. One file, zero dependencies, full analytical power.
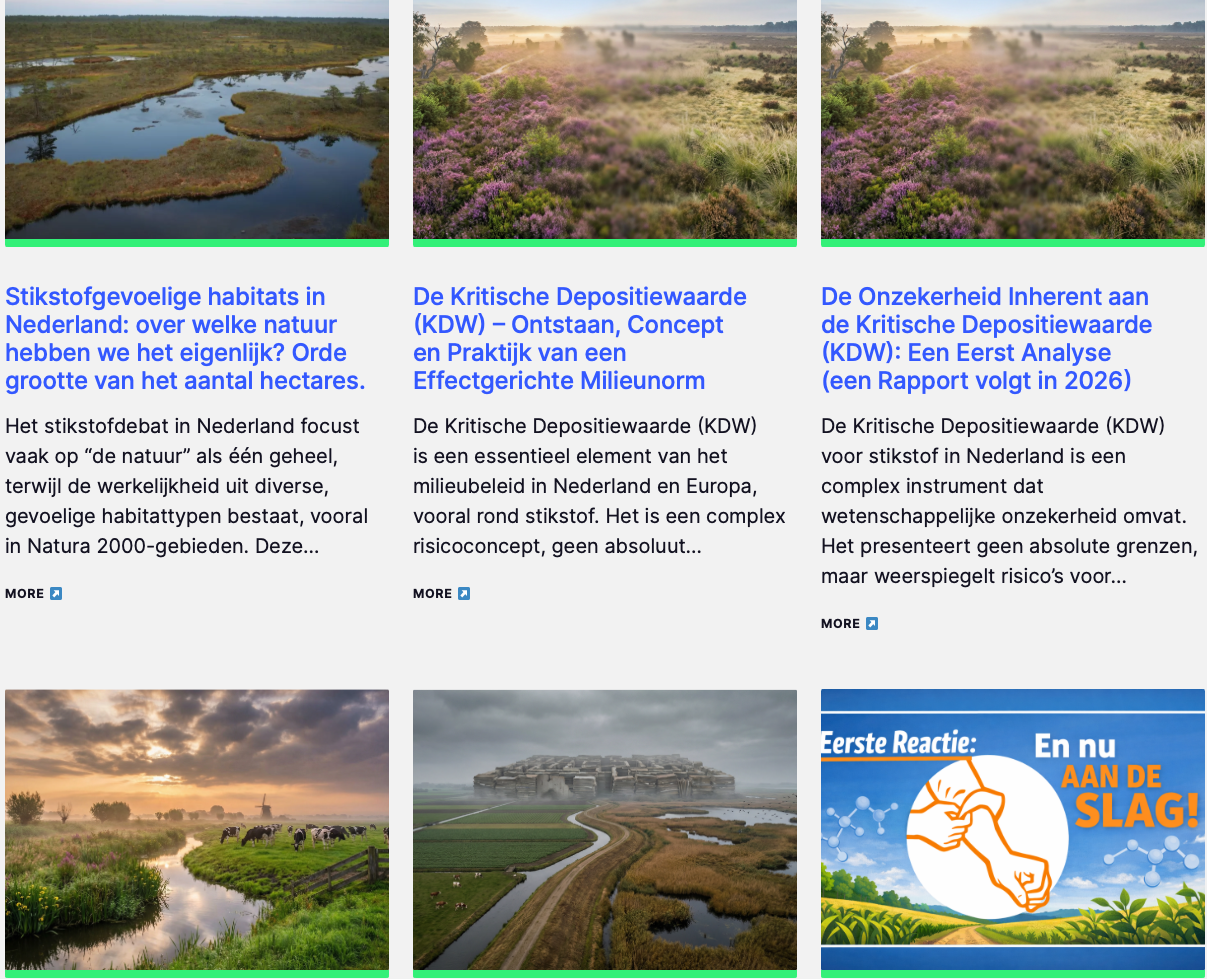
Stikstinfinfo.net also about Nature (Quality) in Dutch Articles
Stikstofinfo.net is not just about numbers, models, or policy. It is equally about nature itself. Beyond emissions and regulations, we publish in-depth articles on nature and nature quality: how ecosystems function, how soils, water, vegetation and biodiversity interact, and what actually determines whether nature is resilient or vulnerable.
Our articles explore the real, measurable state of Dutch nature — from heathlands and grasslands to wetlands and forests — and place nitrogen in its proper ecological context. We distinguish between pressure, impact and management, and look critically at how nature is monitored, restored and governed.
By combining ecology, field data and long-term perspective, stikstofinfo.net aims to move the debate beyond slogans — towards a deeper understanding of what nature needs to thrive.
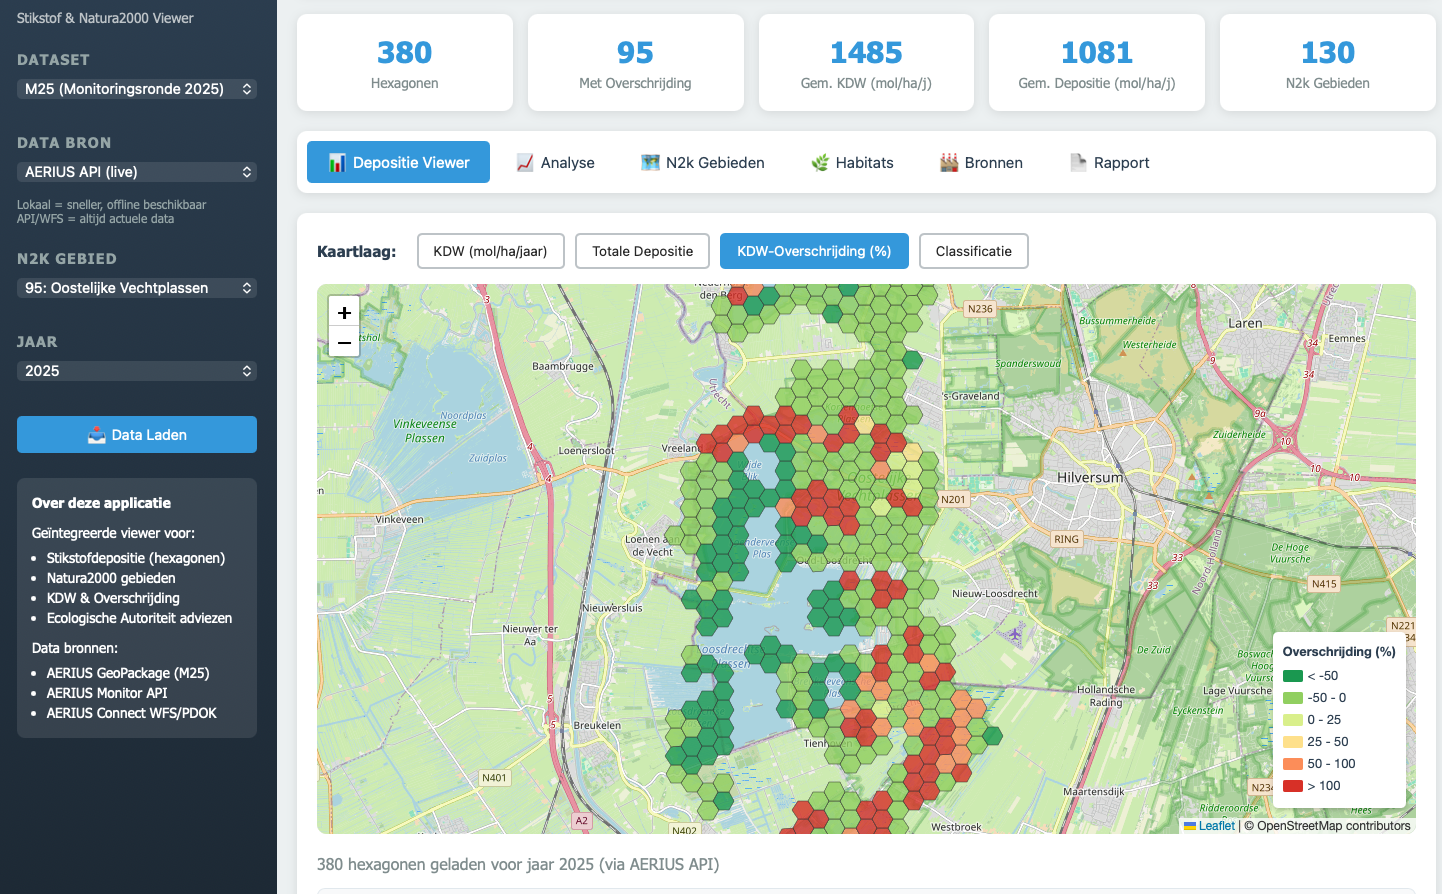
Nitrogen Deposition Analysis Tool
This interactive web application visualizes nitrogen deposition data for all 130 Natura2000 areas in the Netherlands using hexagonal grid analysis. Users select an area to view deposition values, critical deposition loads (KDW), and exceedance levels per hexagon on an interactive map.
The tool includes five analytical tabs: an overview dashboard with summary statistics, detailed hexagon-level data tables, distribution charts comparing deposition against KDW thresholds, source attribution analysis showing contributions by sector and country, and a comprehensive report generator.
eports consolidate all statistics and visualizations into a print-ready format exportable as PDF. Data is sourced from AERIUS Connect via GeoJSON and WFS APIs, covering deposition grids, relevant habitats, and emission source breakdowns. The tool supports environmental assessments and nitrogen policy evaluation.
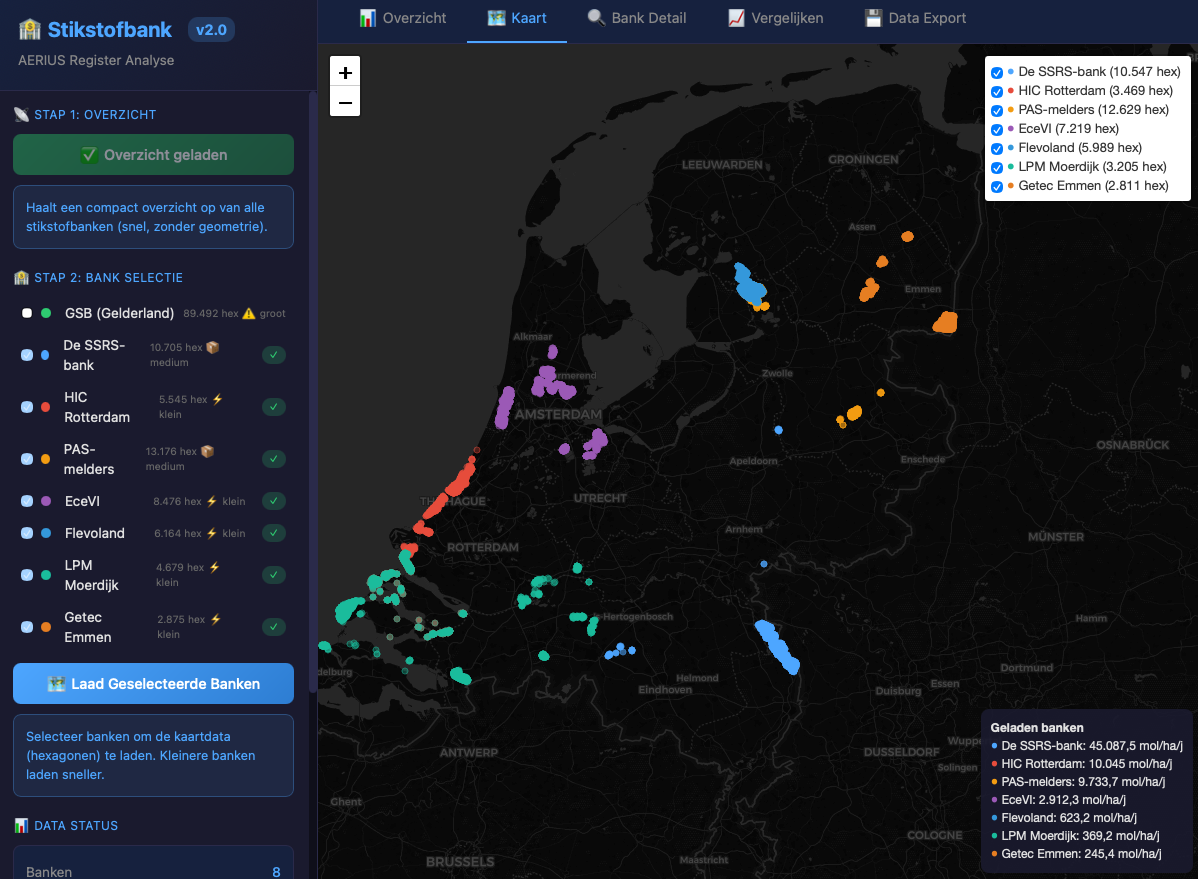
Stikstofbank - Available and reserved Nitrogen space in NL.
The Stikstofbank Viewer provides real-time insight into the reserved and available nitrogen space within the Dutch national and provincial nitrogen banks from AERIUS Register. Connecting directly to the official WFS open data API, it visualises all seven active nitrogen banks with interactive maps, utilisation gauges, and comparative analytics.
A smart two-step loading process delivers instant bank summaries before selectively loading hexagon-level geometry data on demand. Compare banks side by side, explore individual receptor values, and export everything to CSV or Excel.
Built as a single HTML file in the same sleek dark-themed design, it requires no installation and works entirely in your browser.
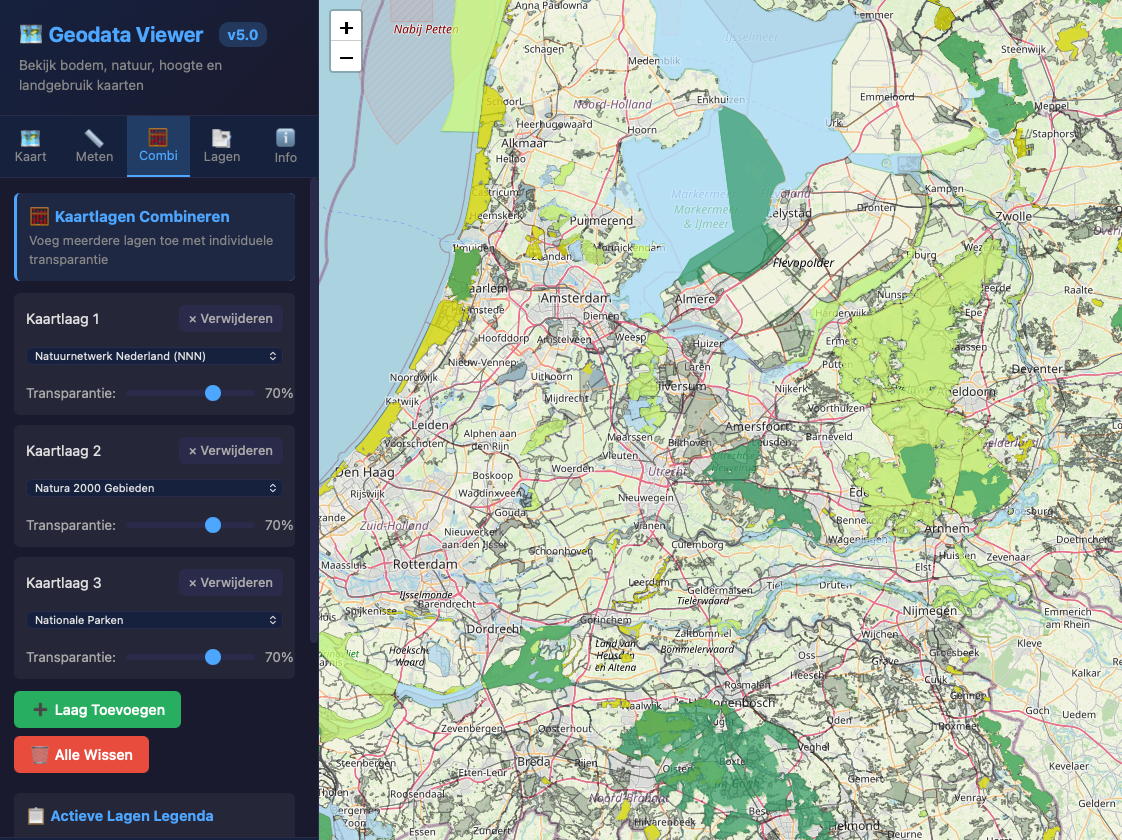
Discover the Netherlands Like Never Before
Explore the Dutch landscape through powerful, interactive maps powered by official PDOK open data. The Kadaster & Landbouw Viewer gives you instant access to cadastral boundaries, agricultural crop parcels, building footprints, aerial photography, and administrative borders — all in one seamless interface.
Select any province or municipality and watch the map zoom straight to your area of interest. Layer multiple datasets to uncover hidden patterns: overlay crop parcels on aerial imagery, compare cadastral boundaries with building data, or examine land use at neighbourhood level. Click any parcel or building to instantly retrieve detailed information — from plot size and crop type to construction year and land registration data.
Whether you are a researcher, policymaker, farmer, or simply curious about Dutch geography, this viewer puts the Netherlands' richest spatial datasets at your fingertips. Free, fast, and endlessly insightful.