The Water Suite
(under construction)
Habitat Statistics — N2k Regional Analysis
This interactive web application provides detailed habitat statistics for all 130 Natura2000 areas in the Netherlands. Users can analyze data at three levels: individual N2K area, province, or nationwide.
For each selection, the tool calculates habitat surface areas (hectares), critical deposition values (KDW), and area-weighted average KDW using live data from the AERIUS Connect WFS API.
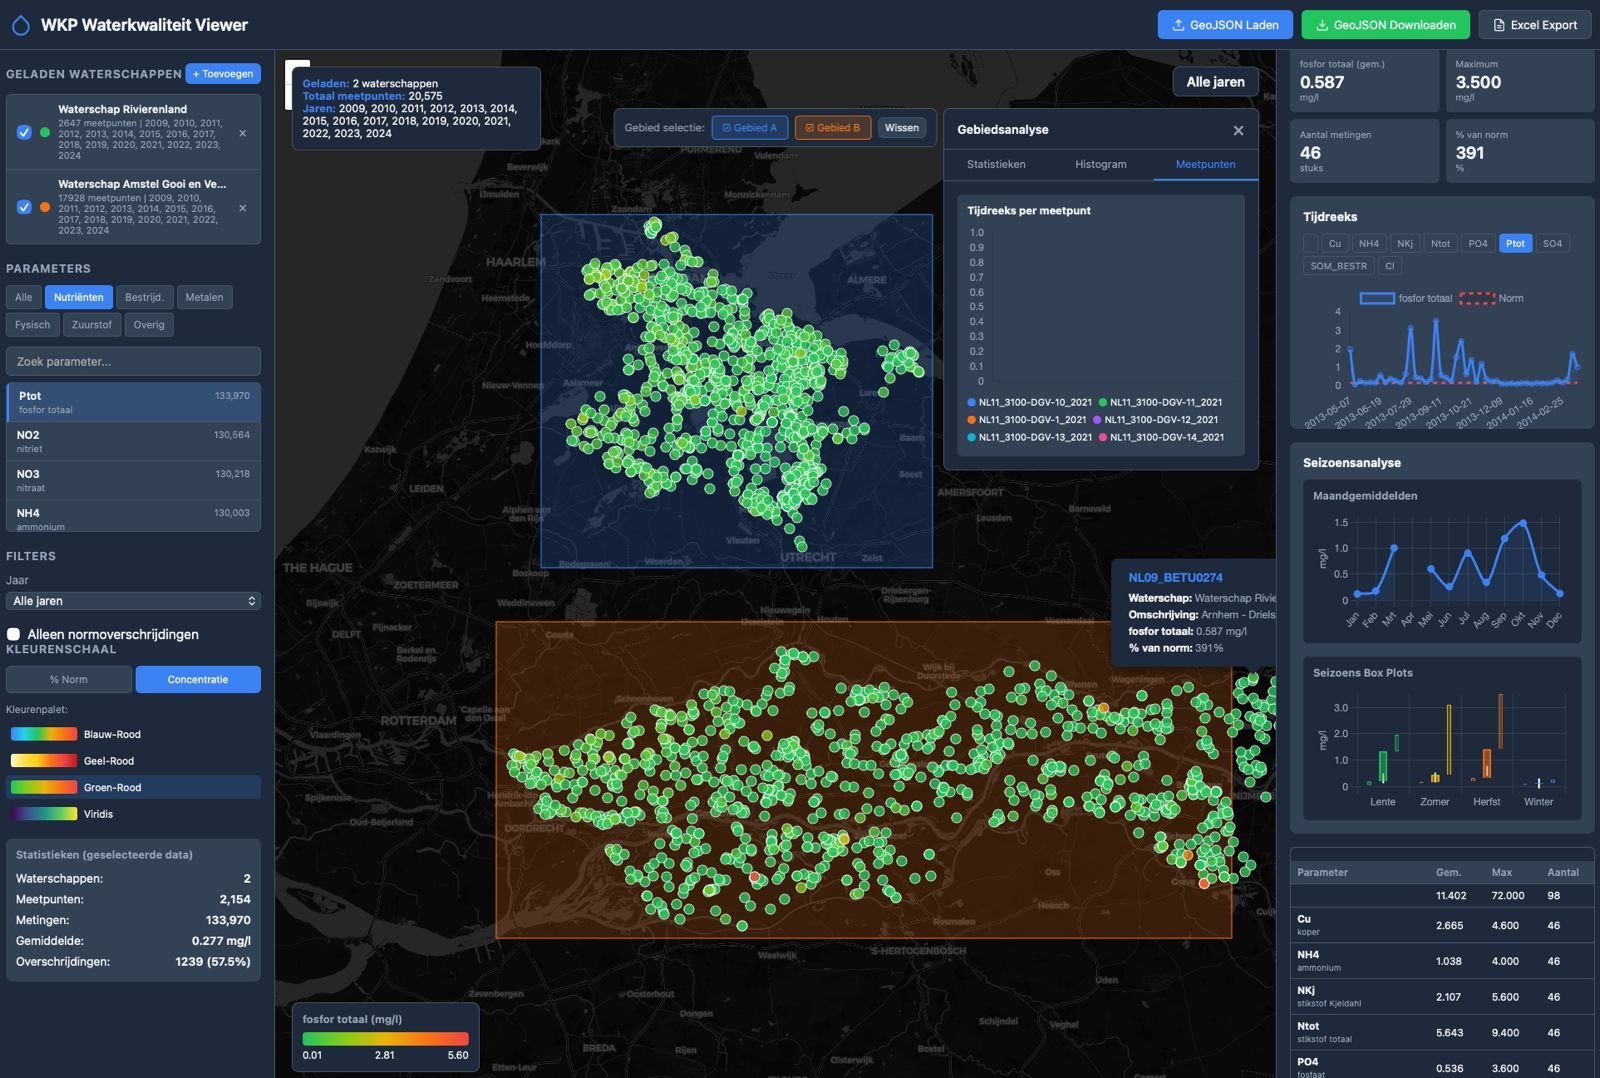
It features an interactive map with color-coded habitat polygons, sortable statistics tables, six analytical charts, a sensitivity analysis by KDW class, and a side-by-side comparison of multiple N2K areas.
Results can be exported to CSV or printed to PDF. The tool helps ecologists and policymakers assess nitrogen-sensitive habitats across different administrative regions.
Nitrogen Deposition Analysis Tool
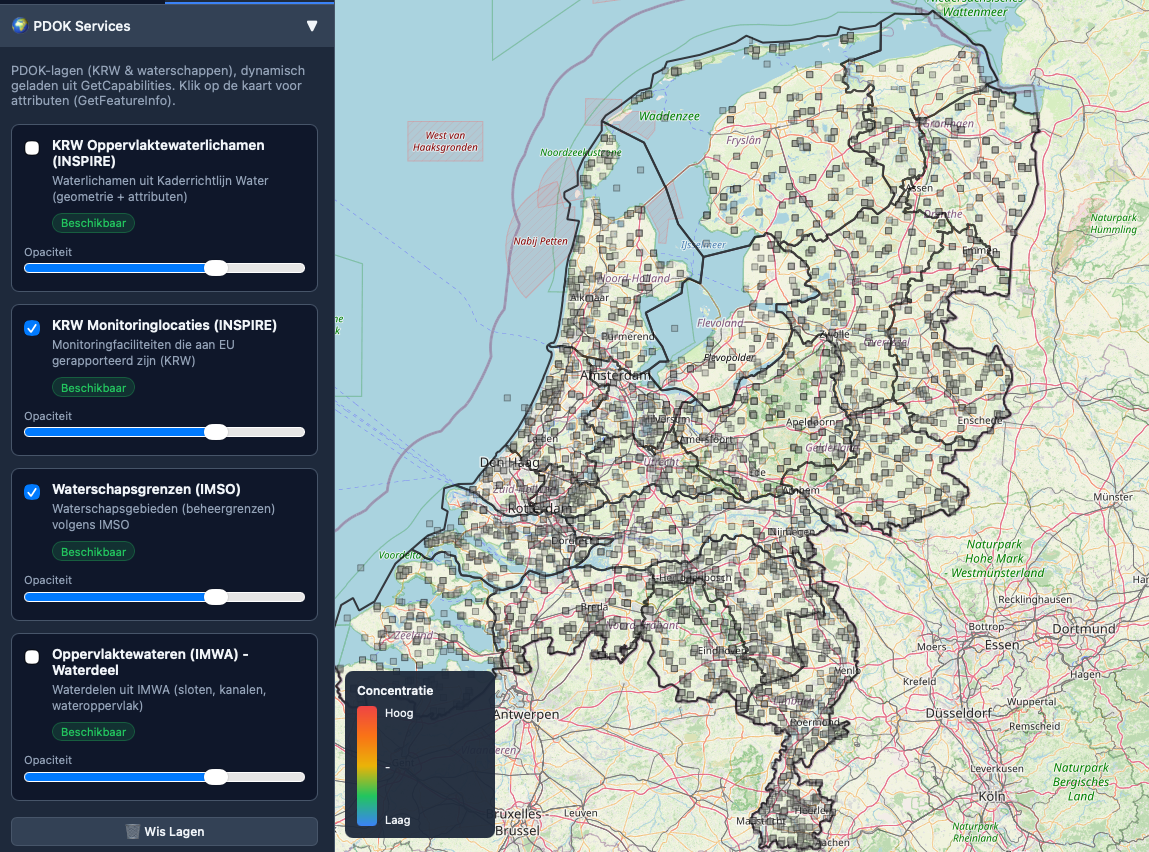
This interactive web application visualizes nitrogen deposition data for all 130 Natura2000 areas in the Netherlands using hexagonal grid analysis. Users select an area to view deposition values, critical deposition loads (KDW), and exceedance levels per hexagon on an interactive map.
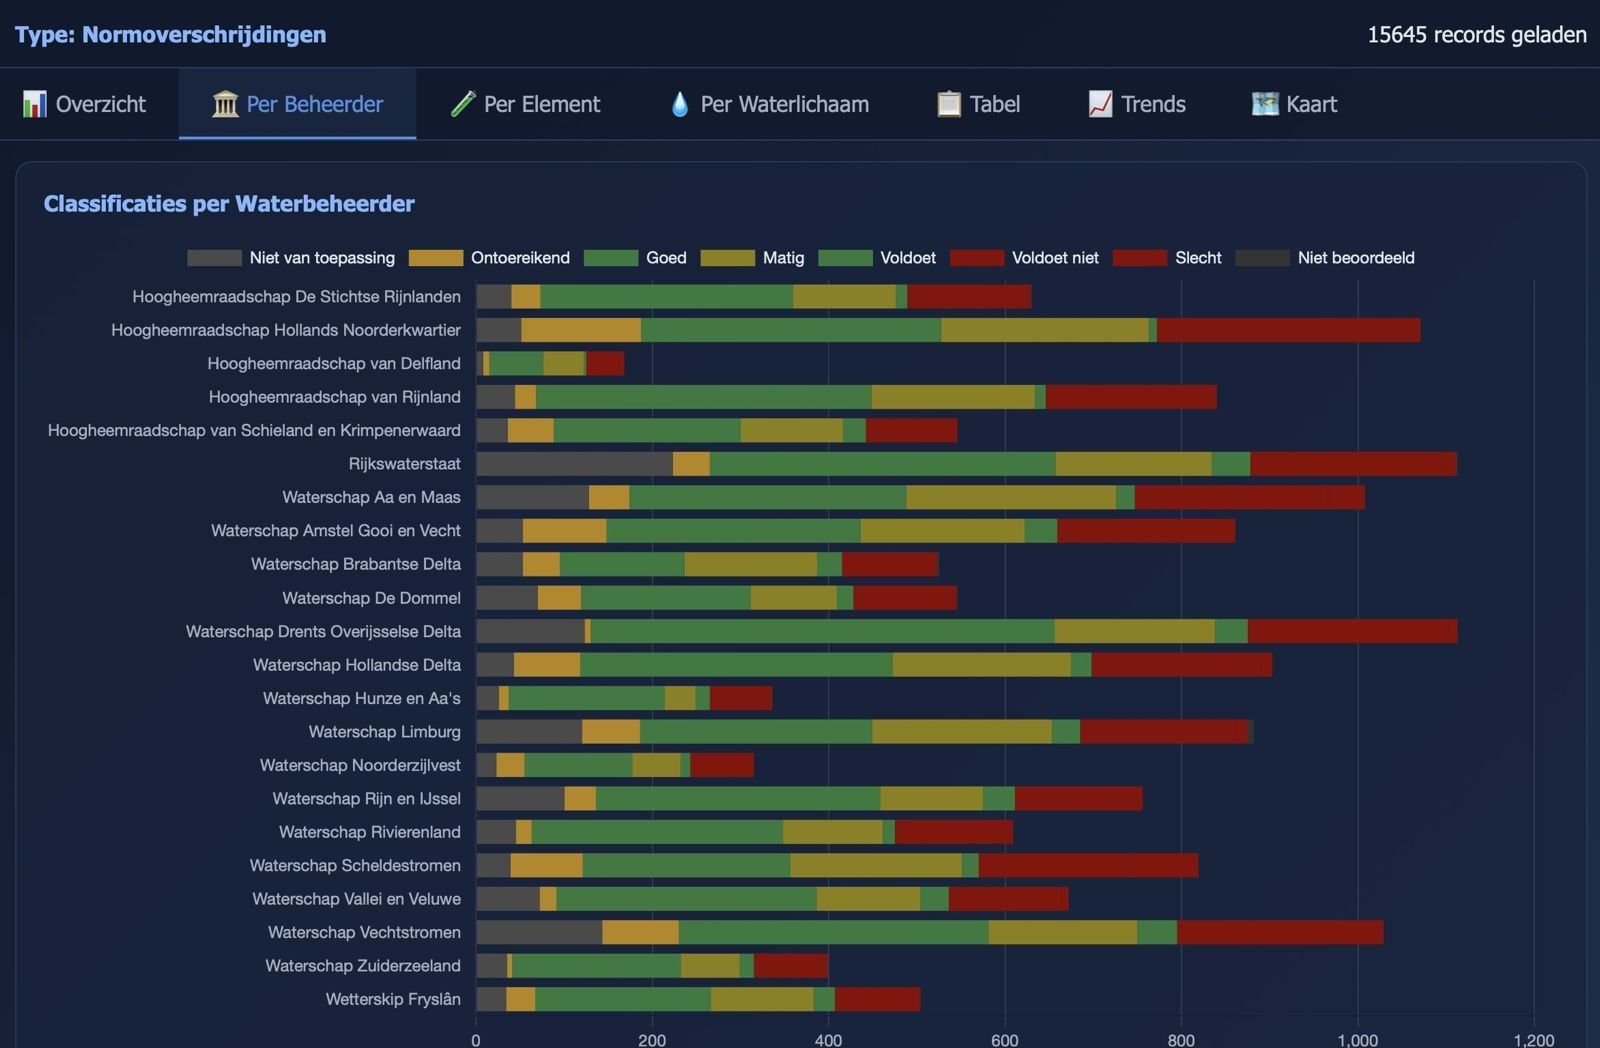
The tool includes five analytical tabs: an overview dashboard with summary statistics, detailed hexagon-level data tables, distribution charts comparing deposition against KDW thresholds, source attribution analysis showing contributions by sector and country, and a comprehensive report generator.
eports consolidate all statistics and visualizations into a print-ready format exportable as PDF. Data is sourced from AERIUS Connect via GeoJSON and WFS APIs, covering deposition grids, relevant habitats, and emission source breakdowns. The tool supports environmental assessments and nitrogen policy evaluation.